
This article discusses how a given accuracy improvement over AEMO’s default wind and solar forecasting system, AWEFS/ASEFS, can translate to a greater improvement in Market Participant Factor (MPF). This leads to greater reduction in FCAS Causer Pays charges.
Familiarity with the relationship between generation, load and frequency is helpful in understanding concepts discussed below.
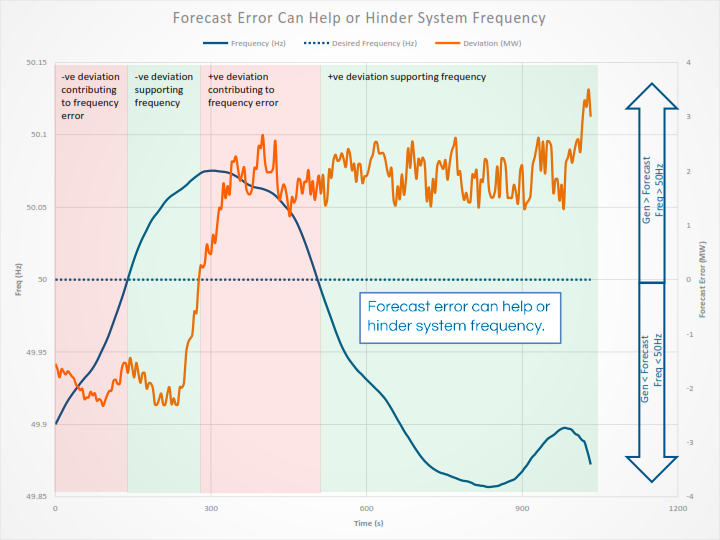
If there is more load than generation, system frequency decelerates. If there is too much generation and insufficient load, frequency will accelerate.
The introduction of the below video explains the concept nicely.
In Australia, AEMO uses Regulation FCAS to try to balance supply and demand. AEMO recoups the cost of regulation FCAS via the Regulation FCAS Contribution Factors Procedure. Wind and solar farms (as well as other generators and loads) receive a bill when the calculations demonstrate they are causing the need for regulation FCAS.
Considering FCAS causer pays on a high level, it is tempting to imagine the dispatch error of all generators will be randomly distributed at any given point in time. Therefore, assuming approximately 0MW average forecast error over the 28-day assessment period, why do wind and solar farms not average out to a Market Participant Factor close to zero?
Causer Pays Methodology
Every 4s, AEMO calculates FI (Frequency Indicator). This is the sum of all dispatched regulation (in MW) in the region at that instant.
FI is multiplied by each generator’s error from their Reference Trajectory. This product (Performance Measure) forms the LNEF (Lower Not Enabled Factor) and RNEF (Raise Not Enabled Factor) which, when averaged over a 28-day period, determine whether that generator was helping reduce the need, or causing the need, to dispatch more FCAS regulation lower and raise respectively.
The reference trajectory is a linear ramp between dispatch intervals – the 5-minute targets are determined either by ASEFS/AWEFS forecast or by the Participant’s self-forecasting submission.
Causer Pays Scenarios
Consider a wind farm expected to be generating 100MW at a given instant, but is only generating 90MW. The absolute error is 10MW.
Case 1: Frequency is 50.05 Hz and AEMO has dispatched 20MW of regulation lower to help move frequency back to 50Hz.
Case 2: Frequency is 49.95 Hz and AEMO has dispatched 20MW of regulation raise to help move the frequency back to 50Hz.
Case 1 Impact on Causer Pays
Performance Measure = 200 (10MW error x 20MW regulation). This value of 200 will contribute positively to the generator’s LNEF score because it is off its target in a manner that helps move frequency towards 50Hz. AEMO needs to dispatch less regulation lower service than if the generator was on its target (in which case its PI would be zero).
Case 2 Impact on Causer Pays
Performance Measure = 200. This value of 200 contributes negatively to the generator’s RNEF score. This is because the wind farm is generating less than expected, and system frequency is already low (representing a shortage of generation or excess load).
Why does Causer Pays not Average to Zero?
In the above scenario, it may appear causer pays should average to zero. Half the time a generator may generate above its forecast, and half below. Additionally, half the time the frequency is too high, and half the time it is too low. 1)This is due to the fact AEMO targets zero accumulated time error. Why zero accumulated time error should be targeted is a good question. Few people still use electric clocks.
The Power System has Finite Inertia
While the distribution of forecast error should be random and approximately average to zero, the power system should not be considered an infinite grid. An imbalance in supply and demand does cause the grid frequency to accelerate or decelerate. Forecast error moves system frequency and requires regulation FCAS in the opposite direction to correct it.
Punishment and Reward are Asymmetrical
Being off target in a helpful manner reduces the amount of regulation FCAS AEMO would otherwise dispatch. Being off target in an unhelpful manner increases the amount of regulation FCAS that is dispatched. The amount of dispatched regulation is used to calculate the Performance Measures.
Consider an otherwise perfect dispatch. Loads match generation , except for a single generator producing 10MW more than forecast. This 10MW error accelerates the system frequency (over a number of 4s intervals). In response to the dispatch error and acceleration above 50Hz, AEMO would dispatch regulation lower (again over a number of 4s intervals). It takes time to command a regulation-enabled generator and for that generator to respond by decreasing its output. From the moment AEMO calls upon the regulation lower, the off-target generator begins accumulating negative Performance Measures allocated to the LNEF metrics.
Consider again the scenarios discussed above, where supply matches demand (when AEMO dispatches the below levels of regulation FCAS).
Case 1: Frequency is 50.05 Hz and AEMO has dispatched 20MW of regulation lower.
Case 2: Frequency is 49.95 Hz and AEMO has dispatched 20MW of regulation raise.
Suddenly, a wind farm starts generating 10MW less than expected.
The initial Performance Measures for this wind farm are +200 to LNEF and -200 to RNEF for Case 1 and Case 2 respectively. If all other generators and loads remain constant, over the next tens of seconds, these scores diverge.
Case 1: Frequency will move towards 50Hz. Effectively, there is a 10MW imbalance decelerating the frequency. AEMO will reduce the amount of regulation lower they dispatch. LNEF credits accrued through the accumulation of successive Performance Measures (error x dispatched regulation) will reduce. This is because the wind farm error offsets the amount of regulation lower which would otherwise have been required. The 4s Performance Measures trend towards 100:
(20MW reg lower existing – 10MW reg lower avoided due to wind farm shortfall) x (10MW forecast error)
Case 2: Frequency will drift lower due to the wind farm’s 10MW under-delivery. RNEF debits will continue to accrue and in fact grow. The power system reaches steady state when AEMO dispatches an additional 10MW of regulation raise to compensate for the wind farm’s 10MW shortfall. The 4s Performance Measures trend towards 300:
(20MW reg raise existing + 10MW reg raise to offset wind farm shortfall) x (10MW forecast error)
The same magnitude forecast error generates different LNEF/RNEF credits/debits depending on whether the forecast error is helping or hindering system frequency.
This is why causer pays does not average to zero.
It may still be hard to believe that a single generator can move system frequency. AEMO’s 4s data files show that on many occasions, the amount of regulation FCAS AEMO dispatched can be quite low (e.g. <20MW). This supports the theory that load and generation forecast errors do typically average to a value close to zero.
Contact SCADA Miner to start self-forecasting and reduce your causer pays bill.
Footnotes
| ⇑1 | This is due to the fact AEMO targets zero accumulated time error. Why zero accumulated time error should be targeted is a good question. Few people still use electric clocks. |
|---|